

Picture this. You open your brand report and see “Nike” at 72, “NIKE Inc.” at 65, and “nike.com” at 58. Same company, three different rows. Meanwhile, one source scores brands out of 10 and another out of 100.
Now your boss asks, “So who’s winning in our category?” You can’t answer honestly, because the data isn’t comparable.
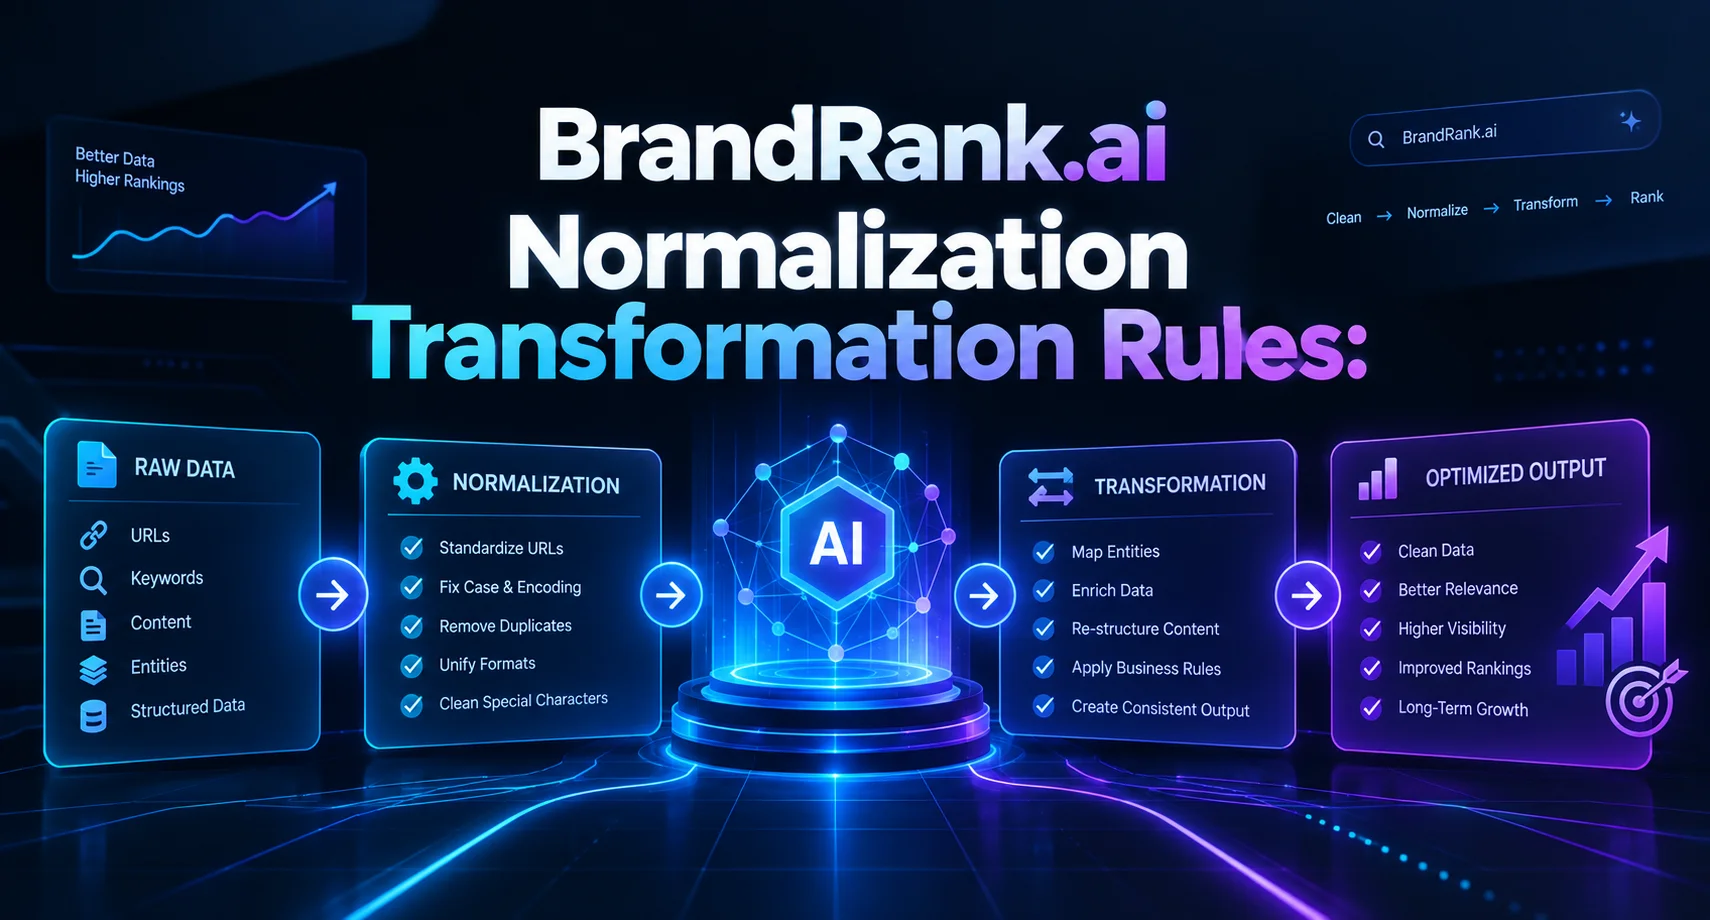
This is the problem normalization transformation rules solve. In this guide, I’ll walk you through what they are, how they work in brand ranking and AI-visibility tools like BrandRank.ai, and how to apply them without a data science degree.
What Happened When I Compared Five SEO Brands
When I first compared five well-known SEO brands, I expected the numbers to line up easily. They didn’t. The traffic data was shown as actual visits, while the Authority Score was already on a 1–100 scale. Putting the two side by side made the comparison look more meaningful than it really was.
So I cleaned up the brand names, kept one row per domain, and converted the traffic figures to a 0–100 scale using min-max normalization. Once everything shared a common scale, the table became much easier to read and, more importantly, easier to explain.
Before Normalization
What was wrong: Traffic was measured in visits, while Authority Score was already on a 1–100 scale. The numbers can’t be compared directly.
After Normalization
Keep that example in mind. I’ll come back to it below.
First, What Is BrandRank.ai?
BrandRank.ai is a SaaS platform that tracks how brands appear inside AI-generated answers from tools like ChatGPT, Gemini and Claude security. Brands use it to see how visible they are when people ask AI engines for recommendations.
That’s exactly where normalization matters. Every AI engine answers differently, ranks sources differently and mentions brands differently. To compare them fairly, you first have to bring everything to the same standard.
A quick honest note: BrandRank.ai doesn’t appear to publish a page specifically titled “normalization transformation rules.” This guide explains the concept and how it applies to platforms like it. For tool-specific settings, ask your team or check your dashboard docs.
So What Are Normalization Transformation Rules, Really?
They’re simple “if this, then do that” instructions that clean and standardize your data before you analyze it.
| Raw data | After normalization |
| Nike, NIKE Inc., nike.com | Nike |
| 8/10, 80%, 4 out of 5 stars | 80 / 100 |
| 03-10-2026, Oct 3 2026 | 2026-10-03 |
| “great”, “Great!!”, “GREAT” | positive |
Nothing fancy. But after this step, your numbers finally mean the same thing everywhere.
How Do Normalization Rules Affect Brand Performance Metrics?
Metrics like visibility score, share of voice, sentiment and ranking position all depend on clean inputs.
Without normalization
- Brand mentions get split across name variations, so it looks smaller than it is
- A generous scoring source makes some brands look better than they are
- “Growth” appears in your charts only when the format changed
With normalization
- Mentions are counted once, under one brand
- Scores sit on the same scale
- Trends reflect real movement, not data glitches
Can Normalization Improve the Accuracy of Brand Comparison Tools?
Yes, and this is probably its biggest benefit. A comparison is only fair when every brand is measured the same way.
Normalization helps by removing source bias, merging duplicate entities, and making scores comparable across countries, languages and platforms.
Two cautions. It won’t fix bad data, because it will just make bad data look neat. And min-max results are relative: in my five-brand comparison, the lowest-traffic brand became 0, and the highest became 100. That doesn’t mean the lowest brand has “zero” traffic, only that it’s the smallest in that group. Always say which group you compared.
Best Practices for Normalization Rules in Brand Ranking Platforms
- Create one master brand list. Include the official name, aliases, domains and product names. Everything maps back to that.
- Write your rules down. If nobody can explain why a rule exists, nobody will trust it in six months.
- Never overwrite raw data. Keep the original and apply rules on top, so you can always trace a number back.
- Pick your scaling method with purpose. Min-max works for bounded scores, z-scores for comparing against an average, and percentiles when outliers are messing things up.
- Compare like with like. Same category, same region, same time period.
- Spot-check after every change. Review 20 to 30 records by hand. It takes ten minutes.
- Revisit your rules regularly. AI engines and data sources change formats without warning.
My Biggest Mistake (So You Can Skip It)
I started by treating the numbers as if they were already comparable. A traffic figure like 47.4 million and an Authority Score of 89 both look useful, but they measure completely different things on completely different scales. The cleaning step forced me to slow down and decide what each number represented before I combined anything.
If you take one lesson from this guide, make it this: ask what each number measures before you compare it.
Standard Data Transformation Techniques for Brand Metrics
| Technique | What it does | Use it when |
| Min-max scaling | Squeezes values into 0–100 | Scores from different sources |
| Z-score | Shows distance from the average | Compare against a category benchmark |
| Percentile ranking | Turns values into rank positions | Your data has extreme outliers |
| Log transformation | Shrinks huge ranges | Mention counts or traffic |
| Fuzzy matching | Links similar-looking names | “Adidas” vs “Adidas AG” |
| Deduplication | Removes repeats | Combining several sources |
| Weighted scoring | Blends metrics by importance | Building one overall brand score |
How Do AI Platforms Normalize Unstructured Brand Data?
Most brand data isn’t neat rows and columns. It’s paragraphs: AI answers, reviews, articles and social posts. Here’s the usual journey from text to numbers:
- Collect the answers from multiple AI engines
- Spot the brands mentioned in the text using NLP
- Match each mention to the right brand in the master list
- Tag it: sentiment, topic, position in the answer, whether it was recommended
- Turn it into structured fields you can count and chart
- Scale the scores so engines can be compared fairly
BrandRank.AI’s co-founder has pointed out that each AI platform weights sources, freshness and authority differently. That’s the whole reason this last step matters.
How to Keep Brand Data Consistent Across Multiple Sources
- Agree on one naming style and share it with everyone
- Give every brand and product a unique ID
- Define your metrics clearly. What counts as a “mention”?
- Standardize dates, time zones and currencies
- Apply the same rules to every source, not quick one-off fixes
- Add automatic checks for duplicates, blanks and impossible values
- Keep a change log so you know what changed and when
The Habit I Now Recommend
Before every competitor report, I create a master brand list. I keep the preferred brand name, domain, source, metric and original score together in one sheet. This makes it much easier to catch duplicate names, mismatched domains and inconsistent scoring before they reach the final report.
Which Companies Offer Tools That Use Normalization Rules for Brand Data?
Features change fast, so confirm on each vendor’s current site.
- AI search visibility: BrandRank.ai, Profound
- Social listening and brand monitoring: Brandwatch, Talkwalker, Meltwater, Sprinklr
- Data cleaning and prep: OpenRefine, Alteryx, Talend, Informatica, Power Query
- Data pipelines: dbt, Fivetran, Snowflake, BigQuery
- SEO suites with brand tracking: Semrush, Ahrefs
Tools That Automate Data Cleansing for Marketing Insights
- Solo or small team: Power Query (Excel/Power BI), OpenRefine or Google Sheets
- Growing team: Alteryx and Talend for visual workflows
- Technical team: dbt or Python (pandas) for full control and testing
Start a small business. A simple, well-documented process beats an expensive tool nobody understands.
Rule-Based vs Statistical vs AI: Which Normalization Approach Is Best?
| Approach | Good at | Watch out for |
| Rule-based | Clear, auditable, predictable | Needs manual updates |
| Statistical | Scaling numbers | Sensitivity to outliers |
| Machine learning | Messy text and unknown name variants | Harder to explain |
| Hybrid | Accuracy and control | More setup time |
My take: go hybrid. Use rules for the predictable parts, AI for messy text, and a human for the edge cases.
Where Can I Find Documentation on Normalization for Brand Analytics?
- your vendor’s help center or support team. Ask BrandRank.ai directly for rule-level details.
- Official docs for dbt, Power Query, OpenRefine and pandas, which are detailed and free
- Cloud docs from Snowflake, BigQuery and Azure on data standardization
- Communities like Stack Overflow and GitHub for real-world examples
Quick Questions People Ask
Is normalization the same as data cleaning?
Not exactly. Cleaning removes mistakes. Normalization makes the format and scale consistent so data can be compared.
How often should I update my rules?
At least every quarter, or any time a source changes its format.
Will normalization change my original data?
It shouldn’t. Always keep a raw copy.
Is this only for big companies?
Not at all. Even tracking five competitors gets easier with consistent naming and scoring.
Your 5-Minute Starting Checklist
- List your brand names, aliases and domains in one sheet
- Put all scores on one scale
- Standardize dates and currencies
- Remove duplicates
- Spot-check 20 records
Final Thoughts
What surprised me most was that these rules aren’t just about making a spreadsheet look cleaner. The real benefit was confidence. Once the names were standardized and the scores shared a common scale, I could see exactly what had changed and explain the calculation instead of simply trusting a messy table.
Fix the foundation first, and everything built on top gets sharper.
Not Sure Which Analytics or Brand Tool Fits Your Business?
Choosing software can eat up days of comparing features and reading reviews. Explore SoftwareCora for clear software comparisons and practical guides that help you pick the right tool with confidence.
Do you clean messy data or test AI visibility tools? Write for SoftwareCora and reach readers who want honest, useful guides. Pitch your idea today
